World Airports 2019
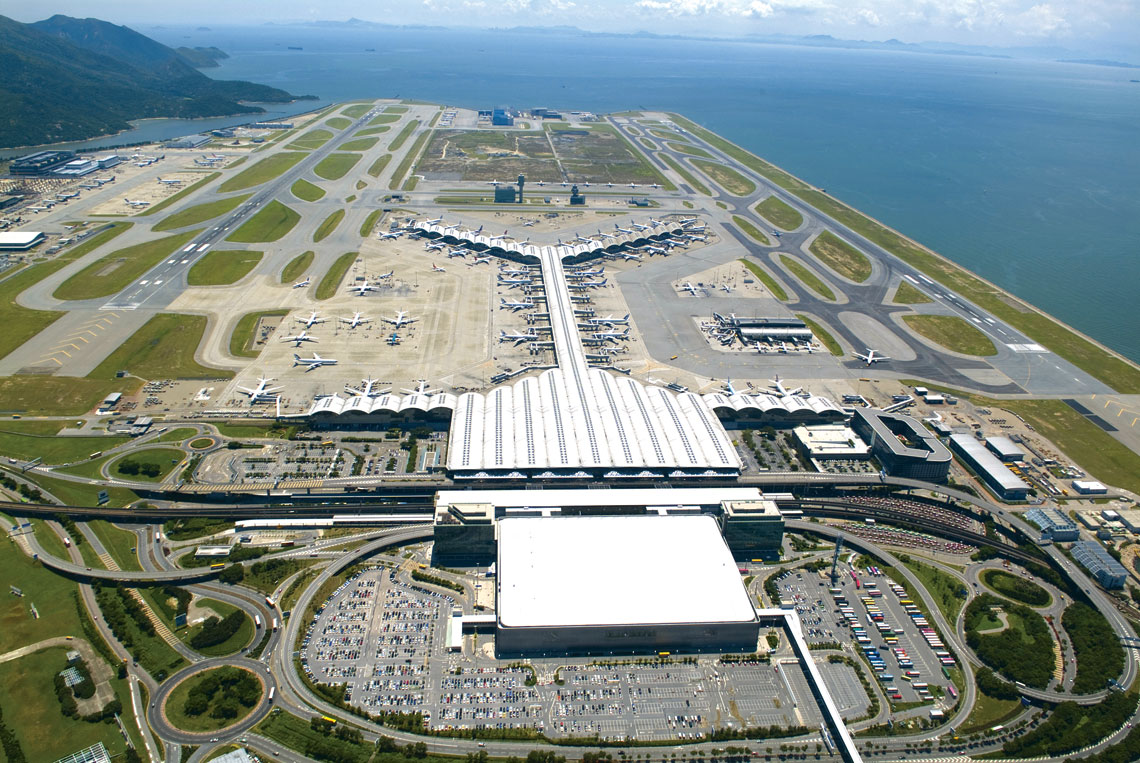
Hong Kong Airport is built on an artificial island with an area of 1255 hectares, created after the leveling of two neighboring ones: Chek Lap Kok and Lam Chau. Construction took six years and cost $20 billion.
Last year, world airports served 9,1 billion passengers and 121,6 million tons of cargo, and communications aircraft performed more than 90 million takeoff and landing operations. Compared to the previous year, the number of passengers increased by 3,4%, while the tonnage of cargo decreased by 2,5%. The largest passenger ports remain: Atlanta (110,5 million tons), Beijing (100 million), Los Angeles, Dubai and Tokyo Haneda, and cargo ports: Hong Kong (4,8 million tons), Memphis (4,3 million tons) , Shanghai, Louisville and Seoul. In the Skytrax ranking in the prestigious category of the best airport in the world, Singapore won, while Tokyo Haneda and Qatari Doha Hamad were on the podium.
The air transportation market is one of the largest sectors of the global economy. It activates international cooperation and trade and is a factor that dynamizes their development. A key element of the market are communication airports and airports operating on them (PL). There are two and a half thousand of them, from the largest, on which aircraft perform several hundred operations a day, to the smallest, where they are performed sporadically. The port infrastructure is diversified and adapted to the volume of air traffic served.
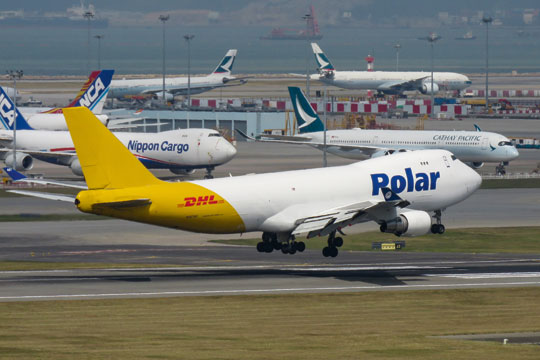
The largest cargo airport in the world is Hong Kong, which handled 4,81 million tons of cargo. 40 cargo carriers operate on a regular basis, including Cathay Pacific Cargo, Cargolux, DHL Aviation and UPS Airlines.
Airports are mainly located near urban agglomerations, and due to the safety of air operations, large occupied areas and noise interference, they are usually located at a considerable distance from their center. For European airports, the average distance from the center is 18,6 km. They are closest to the centre, including those in Geneva (4 km), Lisbon (6 km), Düsseldorf (6 km) and Warsaw (7 km), while the furthest are Stockholm-Skavsta (90 km) and Sandefjord Port. Thorp (100 km), serving Oslo. According to the operational and technical characteristics and the possibility of servicing certain types of aircraft, airports are classified according to the system of reference codes. It consists of a number and a letter, of which the numbers from 1 to 4 represent the length of the runway, and the letters from A to F determine the technical parameters of the aircraft. A typical aerodrome that can accommodate, for example, Airbus A320 aircraft, should have a minimum code of 3C (i.e. runway 1200-1800 m, wingspan 24-36 m). In Poland, Chopin Airport and Katowice have the highest 4E reference codes. Codes given by ICAO and the IATA Air Carriers Association are used to designate airports and ports. ICAO codes are four-letter codes and have a regional structure: the first letter indicates a part of the world, the second indicates an administrative region or country, and the last two indicate a specific airport (for example, EDDL - Europe, Germany, Düsseldorf). IATA codes are three-letter codes and most often refer to the name of the city in which the port is located (for example, BRU - Brussels) or its own name (for example, LHR - London Heathrow).
The financial income of airports from annual activities is at the level of 160-180 billion US dollars. The funds received from aviation activities are mainly formed from fees for: handling passengers and cargo in the port, landing and emergency stop of the aircraft, as well as: de-icing and snow removal, special protection and others. They make up about 55% of the total revenue of the port (for example, in 2018 - 99,6 billion US dollars). Non-aeronautical revenues account for about 40% and are mainly derived from: licensing, parking and rental activities (for example, in 2018 - $ 69,8 billion). The costs associated with the operation of the port annually consume 60% of revenues, a third of which is accounted for by the salaries of employees. Every year, the cost of expanding and modernizing the airport infrastructure is 30-40 billion US dollars.
The organization that unites airports in the world is the ACI Airports Council International, established in 1991. It represents them in negotiations and negotiations with international organizations (eg ICAO and IATA), air traffic services and carriers, and develops standards for port services. In January 2020, 668 operators joined ACI, operating 1979 airports in 176 countries. 95% of the world's traffic passes there, which makes it possible to consider the statistics of this organization as representative for all aviation communications. Current statistics related to port activities are published by ACI in monthly reports, approximately annually at the end of the first quarter of the following year, and the final results are published only a few months later. ACI World is headquartered in Montreal and supported by specialized committees and task forces and has five regional offices: ACI North America (Washington); ACI Europe (Brussels); ACI-Asia/Pacific (Hong Kong); ACI-Africa (Casablanca) and ACI-South America/Caribbean (Panama City).
Traffic statistics 2019
Last year, world airports served 9,1 billion passengers and 121,6 million tons of cargo. Compared to the previous year, passenger traffic increased by 3,4%. In some months, the growth in passenger traffic remained from 1,8% to 3,8%, except for January, where it amounted to 4,8%. The high dynamics of passenger traffic was recorded in the ports of South America (3,7%), the growth was due to domestic transportation (4,7%). In the largest markets in Asia-Pacific, Europe and North America, growth averaged between 3% and 3,4%.
Freight transport has changed very dynamically, reflecting the state of the world economy. Global airport traffic decreased by -2,5%, with poor performance in Asia Pacific (-4,3%), South America (-3,5%) and the Middle East. The largest drop in freight traffic occurred in February (-5,4%) and June (-5,1%), and the smallest - in January and December (-0,1%). In the large North American market, the decline was well below the global average of -0,5%. The worst results in cargo transportation last year are the result of a slowdown in the global economy, which caused a reduction in cargo transportation, as well as the start of the COVID-19 epidemic at the end of the year (an unfavorable trend was initiated by Asian airports).
It should be noted that African ports demonstrated the highest dynamics of growth in passenger traffic and the smallest dynamics of decrease in cargo traffic, which amounted to 6,7% and -0,2%, respectively. However, due to their low base (2% share), this is not a statistically significant result on a global scale.
Major airports
There were no major changes in the ranking of the largest airports in the world. The American Atlanta remains the leader (110,5 million pass.), and Beijing Capital is in second place (100 million pass.). They are followed by: Los Angeles (88 million), Dubai (86 million), Tokyo Haneda, Chicago O'Hare, London Heathrow and Shanghai. Hong Kong remains the largest cargo port, handling 4,8 million tons of cargo, followed by Memphis (4,3 million tons), Shanghai (3,6 million tons), Louisville, Seoul, Anchorage and Dubai. However, in terms of the number of takeoffs and landings, the busiest are: Chicago O'Hare (920), Atlanta (904), Dallas (720), Los Angeles, Denver, Beijing Capital and Charlotte.
Of the thirty largest passenger airports (23% of global traffic), thirteen are in Asia, nine in North America, seven in Europe and one in the Middle East. Of these, twenty-three recorded an increase in traffic, with the greatest dynamics achieved: the American Dallas-Fort Worth (8,6%) and Denver, and the Chinese Shenzhen. Among the twenty largest cargoes handled by tonnage (40% of traffic), nine are in Asia, five in North America, four in Europe and two in the Middle East. Of these, as many as seventeen recorded a decrease in traffic, the highest of which are Thailand's Bangkok (-11,2%), Amsterdam and Tokyo Narita. On the other hand, of the twenty-five major takeoffs and landings, thirteen are in North America, six in Asia, five in Europe, and one in South America. Of these, 19 recorded an increase in the number of transactions, with the most dynamic being US ports: Phoenix (10%), Dallas-Fort Worth and Denver.
The driving force behind the growth in passenger traffic was international transportation, the dynamics of which (4,1%) was 2,8% higher than the dynamics of domestic flights (86,3%). The largest port in terms of the number of international passengers is Dubai, which served 76 million passengers. The following ports ranked in this classification: London Heathrow (72M), Amsterdam (71M), Hong Kong (12,4M), Seoul, Paris, Singapore and Frankfurt. Among them, the greatest dynamics was recorded by Qatari Doha (19%), Madrid and Barcelona. Notably, in this ranking, the first American port is only 34,3 (New York-JFK - XNUMX million pass.).
Most large metropolitan areas in the area of their agglomeration have several airports of communication. The largest passenger traffic was in: London (airports: Heathrow, Gatwick, Stansted, Luton, City and Southend) - 181 million lanes; New York (JFK, Newark and La Guardia) - 140 million; Tokyo (Haneda and Narita) - 130 million; Atlanta (Hurstsfield) - 110 million; Paris (Charles de Gaulle and Orly) - 108 million; Chicago (O'Hare and Midway) - 105 million and Moscow (Sheremetyevo, Domodedovo and Vnukovo) - 102 million.