World Airports 2020
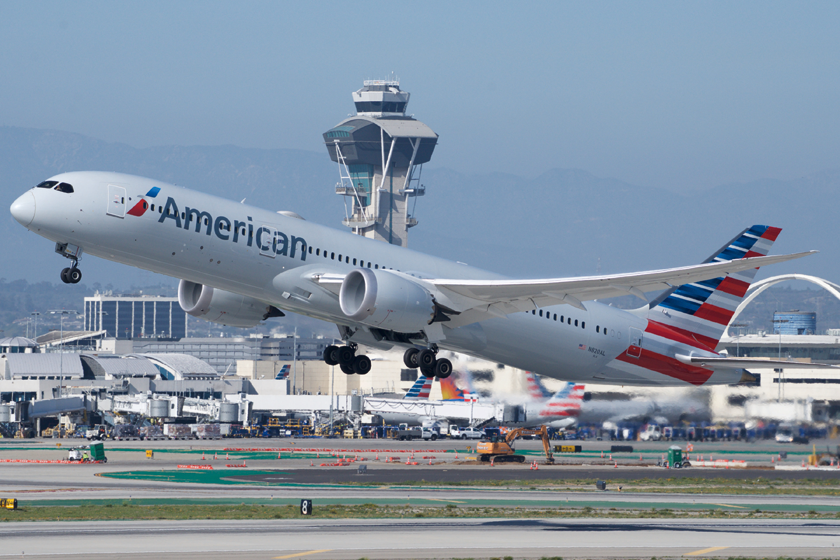
PL Los Angeles served 28,78 million passengers and lost 59,3 million people (-67,3%) compared to the previous year. The picture shows an American Airlines B787 on one of its flights to the airport.
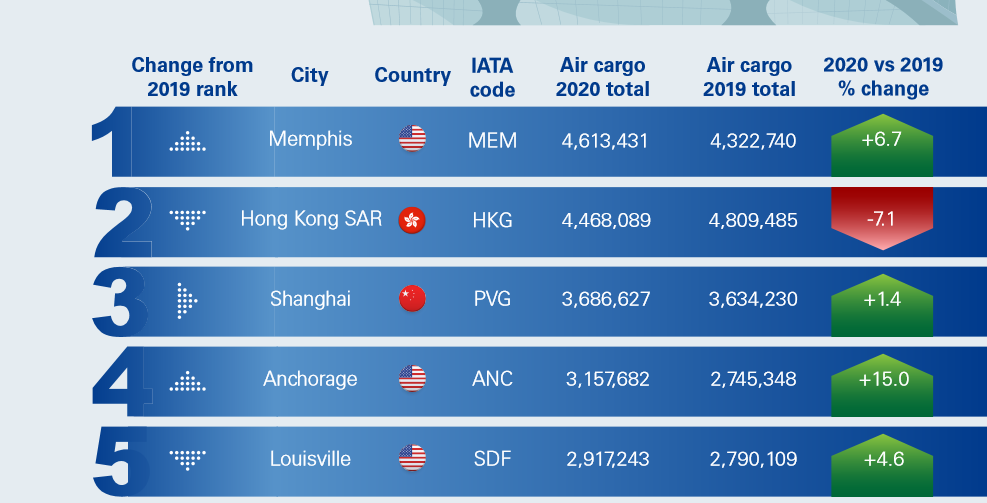
In the crisis year of 2020, the world's airports served 3,36 billion passengers and 109 million tons of cargo, and communications aircraft performed 58 million takeoff and landing operations. Compared to the previous year, air travel decreased by -63,3%, -8,9% and -43%, respectively. There have been dramatic changes in the ranking of the largest airports, and the statistical results reflected the impact of the coronavirus pandemic on their work. The largest passenger ports are Chinese Guangzhou (43,8 million passengers), Atlanta (42,9 million passengers), Chengdu, Dallas-Fort Worth and Shenzhen, and cargo ports: Memphis (4,5 million tons), Hong Kong ( 4,6 million passenger tons), Shanghai, Anchorage and Louisville.
The air transportation market plays a key role in the development of the global economy, being a permanent element of modern society. Air traffic in certain regions of the world is unevenly distributed and depends mainly on the economic level of countries (a large Asian or American port has more cargo traffic than all African ports combined). Communication airports and the airports operating on them are a key element of the market. There are about 2500 of them in operation, from the largest, serving several hundred aircraft daily, to the smallest, where they land sporadically.
Communication airports are mainly located near urban agglomerations, and due to safety requirements, large areas and noise interference, they are usually located at a considerable distance from their center (on average in Europe - 18,6 km). The largest communication airports in the world by area are: Saudi Arabia Dammam King Fahd (776 km²), Denver (136 km²), Istanbul (76 km²), Texas Dallas-Fort Worth (70 km²), Orlando (54 km²). ), Washington Dulles (49 km²), Houston George Bush (44 km²), Shanghai Pudong (40 km²), Cairo (36 km²) and Bangkok Suvarnabhumi (32 km²). However, according to the operational and technical characteristics and the ability to service certain types of aircraft, airports are classified according to the system of reference codes. It consists of a number and a letter, of which the numbers from 1 to 4 represent the length of the runway, and the letters from A to F determine the technical parameters of the aircraft. A typical airport that can handle Boeing 737 aircraft should have a minimum reference code of 3C (runway 1200-1800m).
Codes assigned by the ICAO Organization and the IATA Air Carriers Association are used to designate the location of airports and ports. ICAO codes are four-letter codes, the first letter of which is a part of the world, the second is an administrative region or country, and the last two are the identification of a given airport (for example, EPWA - Europe, Poland, Warsaw). IATA codes are three-letter codes and most often refer to the name of the city in which the port is located (for example, OSL - Oslo) or a proper name (for example, CDG - Paris, Charles de Gaulle).
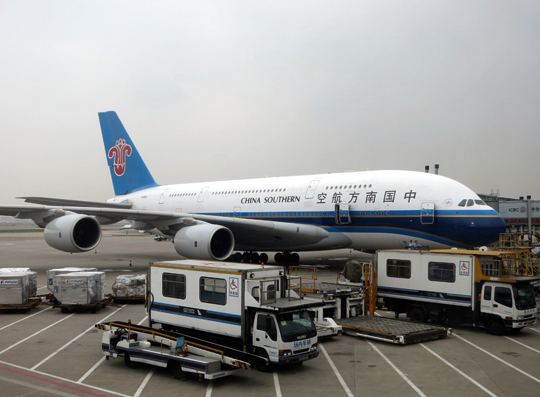
The world's largest Chinese airport, Guangzhou Baiyun International Airport, served 43,76 million passengers (-40,5%). Due to the much worse results of other ports, it has risen 10 positions in the world ranking. China South Line A380 in front of the port terminal.
The organization that unites airports in the world is the Airports Council International ACI, established in 1991. Represents their interests in negotiations and negotiations with: international organizations (for example, ICAO, IATA and Eurocontrol), airlines, air traffic services, develops standards for airport aircraft services. In January 2021, 701 operators joined ACI, operating 1933 airports in 183 countries. 95% of the world's traffic takes place there, which makes it possible to consider the statistics of this organization as representative for all aviation communications. ACI World is headquartered in Montreal and supported by specialized committees and task forces, as well as five regional offices.
In 2019, airport financial revenues amounted to $180,9 billion, including: $97,8 billion. from aviation activities (for example, fees for handling passengers and cargo, landing and parking) and $72,7 billion. from non-aeronautical activities (for example, provision of services, catering, parking and rental of premises).
Air travel statistics 2020
Last year, the world's airports served 3,36 billion passengers, i.e. 5,8 billion less than a year earlier. Thus, the decrease in cargo traffic amounted to -63,3%, and the highest was recorded in the ports of Europe (-69,7%) and the Middle East (-68,8%). In the two major markets of Asia and North America, passenger traffic decreased by -59,8% and -61,3%, respectively. In numerical terms, the largest number of passengers was lost in the ports of Asia and the Pacific Islands (-2,0 billion passengers), Europe (-1,7 billion passengers) and North America.
In the first two months of 2020, flights in most countries were operated without major restrictions, and ports served 1592 million travelers this quarter, accounting for 47,7% of the annual result. In the following months, their operation was marked by the first wave of the coronavirus pandemic, when lockdown (blockade) and restrictions on regular air travel were introduced in most countries. The second quarter ended with 251 million passengers, which is 10,8% of the quarterly result of the previous year (2318 97,3 million passenger-passengers). In fact, the air transportation market has ceased to function, and the largest quarterly drops in traffic volumes were recorded in the following ports: Africa (-96,3%), the Middle East (-19%) and Europe. Since the middle of the year, traffic has gradually resumed. However, with the arrival of the second wave of the epidemic and the introduction of additional restrictions to prevent the spread of Covid-737, air travel has slowed down again. In the third quarter, airports served 22 million passengers, which accounted for 85,4% of the annual result. In relation to the same period of the previous year, the largest quarterly decrease in cargo traffic was then recorded in the following ports: the Middle East (-82,9%), Africa (-779%) and South America. Airports handled 78,3 million passengers in the fourth quarter, and air travel in selected countries was affected by travel restrictions. Ports in Europe recorded the largest quarterly decline in passenger traffic, at -58,5%, while ports in Asia and the Pacific Islands (-XNUMX%) and South America experienced the least losses.